Productivity
Select Productivity from the sidebar for a quick overview of a week. By default, the page opens to the last seven days (up to yesterday), showing 25 users of All Groups. You can view today's data, but it will be incomplete. Use this page to look back, at least back to "yesterday." Thumbnail graphs show at a glance who is working productively and who might need assistance or motivation.
NOTE: Keep in mind that data on this page depends on Productivity Settings, the Workday, and the expected hours of work for a Group. For event data, click User Details, which takes you the Data Explorer view for a user.
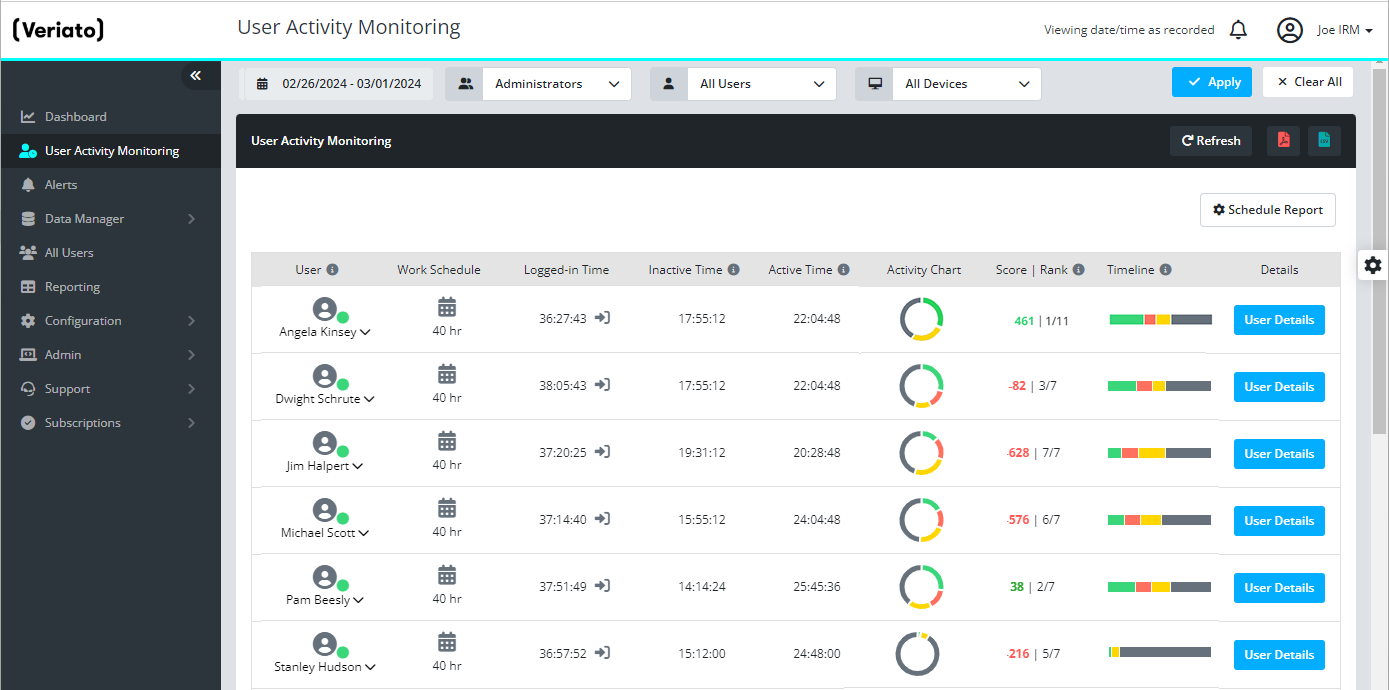
- User - The user column shows the login or display name of the monitored user. Click the drop-down to open a day-by-day status for a user within the selected time range.
- Online/Offline - A green dot circle next to a user indicates the user is currently logged in or has been active (there was a recent logon event, or activity was detected). An empty dot circle indicates no login or active time. If you select "Today" for the date/time filter, all users are shown as "Offline." Opening a user drop-down updates the user data with "Today's" incomplete activity data.
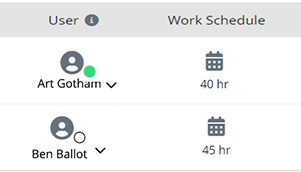
- Work schedule - Shows the expected weekly work hours for this user. Click the calendar to view the settings (Administrator or Manager logins).
- Logged-in Time - The total hours:minutes:seconds during the selected date range the user was active.
Daily logged-in time starts at the beginning of the day (following login, screen unlock, or first activity events on this day) until end of day or last logout or screen lock. - Inactive Time - Of the total logged-in time (during the workday), the time in hours:minutes:seconds the user not typing, scrolling, or using the mouse.
- Active Time - Of the total logged-in time (during the workday), the time in hours:minutes:seconds user was actively typing, scrolling, or using the mouse.
- Activity Chart - A thumbnail chart adds up Inactive time (gray) and Productive (green), Unproductive (red), and Neutral activity (yellow) for the user during the Logged-in period.
Click on a user's top-level Activity Chart to see a day-by-day break-down.
Expand a user's drop-down and click the daily Activity Chart to enlarge it and view which apps and websites were used. - Score | Rank - The Score is based on inactive and rated active time for the logged in period. The Rank compares this user's score with the other selected users. See Score | Rank below.
- Timeline - A visual representation of the logged-in time when inactivity or Productive, Unproductive, or Neutral activity took place. Click on a user's daily timeline to view a breakdown for that day.
- User Details - Link to Data Explorer filtered to the relevant user. Click the back arrow on the top bar to return to Productivity.
- Screenshots (in a user's dropdown) - View screenshots recorded on the day. Screenshot recording must be enabled in the Recording Policy. If continuous Screenshots are not enabled, Application or Website triggered screenshots must have occurred.
How Productivity works
When you're just getting started, you will not see meaningful metrics on this page. To begin, you need to set Workday and Productivity Settings. Keep in mind that meaningful metrics will not be available until users are licensed members of a Group and recording agents are returning data for those users.
Watch a video showing how to configure Productivity:
Productivity depends on:
- Login and Logout
Activity begins when a user logs in or unlocks the monitored device. Activity ends when a user logs off or locks the device. Automatically returned by recording agents. - Active and Inactive Time
Active time (when the user is typing, scrolling, or using the mouse) and inactive time is aggregated for each day. Automatically returned by recording agents. - Workday Settings
A "workday" is the expected start and end times for working and/or how many hours of work are expected. For example, a fixed workday schedule may be five days a week, 8 hours a day (40 hours). A flexible workday schedule may be any days of the week, up to 40 hours of expected weekly activity. Rated activities are accumulated within the frame of the defined workday (e.g., Mon-Friday, 8AM - 5 PM, or any active hours up to 40 hours a week). Adjust the default settings for each group to get desired results! - Productivity Settings
Rating websites and applications as Productive, Unproductive, or Neutral for a Group allows the scoring and ranking comparisons. All websites and apps are Neutral until you rate them!
NOTE: Productivity does not show ALL data. Even when configured, the page includes only a subset of recorded activity. Data Explorer, on the other hand, allows you to see all data available within your Data Retention period.
Score | Rank
This page shows each user's Score | Rank for the selected time (last 7 days by default) and in the dropdown for each day. The Score is obtained by adding points for active time in applications and websites rated "productive" and subtracting points for those rated "unproductive" or for inactive time. A score is assessed only for activity within the range or (number) of hours as defined by the group's workday.
 Unproductive activity: -2 points per minute
 Productive activity: +2 points per minute
 Neutral activity: +1 point per minute
 Inactive time: -1 point per minute for time not active or not logged in.
The Rank is a user's score compared with his/her group. The user with the highest Score in a group of 9 users is ranked 1/9 for the day.
Schedule a reportSchedule a report
At the top of the this page, press Schedule Report to schedule an automatic email report on a group, groups, or selected users to be delivered to recipients of your choice.
NOTE: These reports are NOT tracked in the Reporting section.
A Manager login sees all tools at the top of the Productivity list. A Limited login sees only Scheduled Report.
![]()
- Work Day Settings - Set the expected work hours for a group.
- Productivity Settings - Rate the Websites and Applications used by a group.
- Schedule Report - Schedule an automatic email report on a group, groups, or selected users to be delivered to recipients of your choice. NOTE: These reports are NOT tracked in the Reporting section.
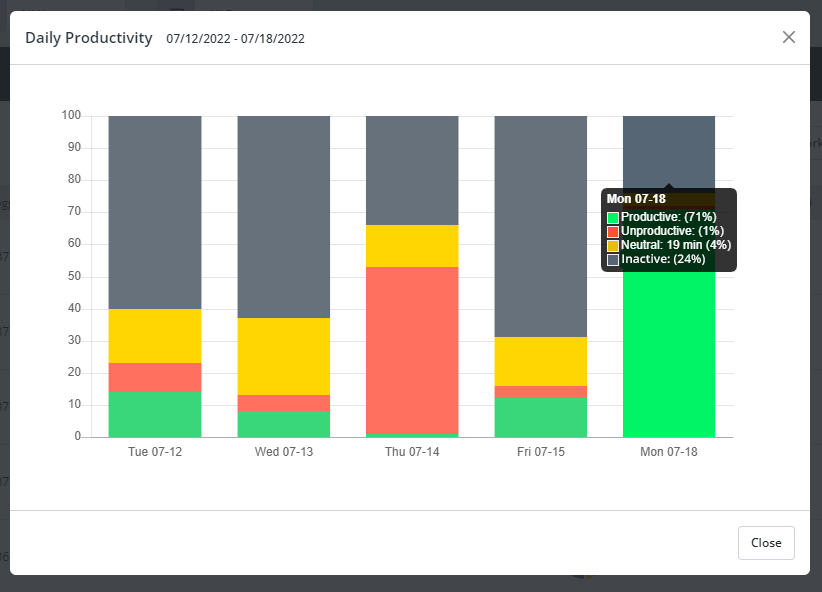
Activity chart -Activity chart - for selected days
Access this chart by clicking the thumbnail Activity Chart on a user's top-level row. The Daily Productivity column chart shows 0-100% of logged in time on the Y-axis and each day in the selected date range on the X-axis. Rollover a day's column to see percentages for activity rated Productive, Unproductive, or Neutral vs. total Inactive (gray) time.
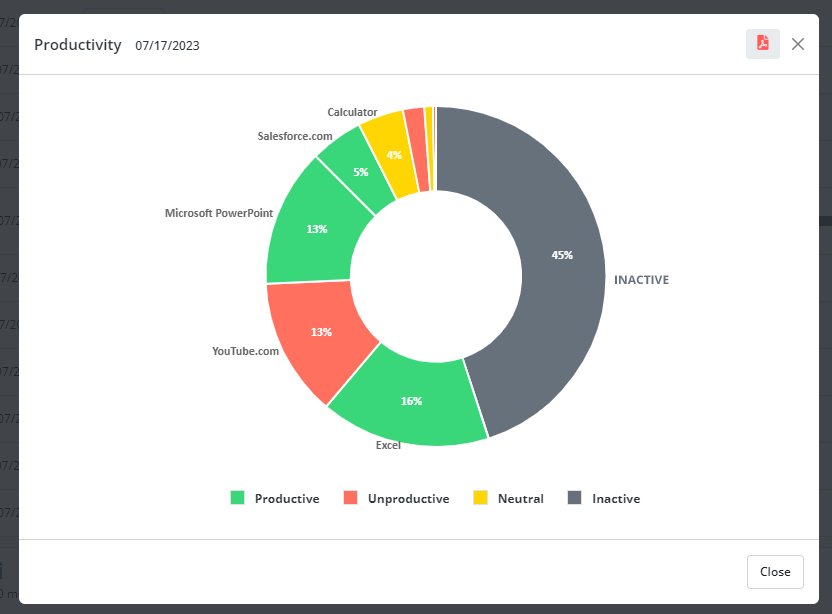
User activity for a single dayUser activity for a single day
Access this chart by opening a user drop-down and clicking the thumbnail Activity Chart for a single day. The thumbnail shows aggregated times, but the enlarged Activity Chart shows each activity. Rollover a colored pie slice to view an app or website name visible. The chart represents 100% of logged in time during the workday. Inactive time is gray, time in productive-rated apps and sites is green, unproductive time is red, and neutral time is yellow.
Activity timelineActivity timeline
The horizontal Timeline bar represents the total time (for a workday) the user was logged in.

Green represents time spent in applications or websites rated Productive, yellow represents Neutral-rated activity, red represents Unproductive activity, and gray is Inactive time. Clicking the top-level timeline opens the userdrop-down, where a similar Timeline bar shows activity for each day.
Click a daily Timeline to open a breakdown timeline for the day: from the user's first activity to the last activitiy of the recorded workday.
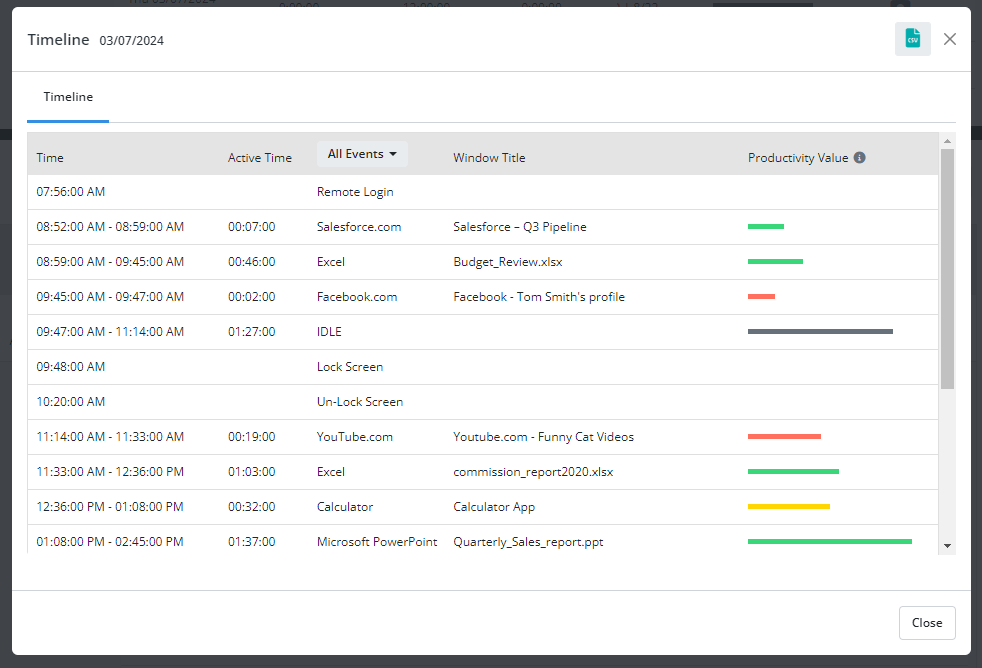
- Time - Start time or Start-End times in hour:minutes:seconds for active or inactive time.
- Active Time - The total time of the active or inactive period.
- All Events - All Events are shown by default. Use the All Events header dropdown to show only:
Login/Off events
Idle (or Inactive) Time, or
Active Time - Window Title - The Window title reveals which file was open or which webpage was viewed.
- Productivity Value- A line represents rated Active time (green, yellow, or red) and Inactive time (gray) as .
Updated: 05/20/2024