Alerts
Interguard offers a variety of alerting methods. The Alerts page shows when and why alerts were triggered and who triggered them.
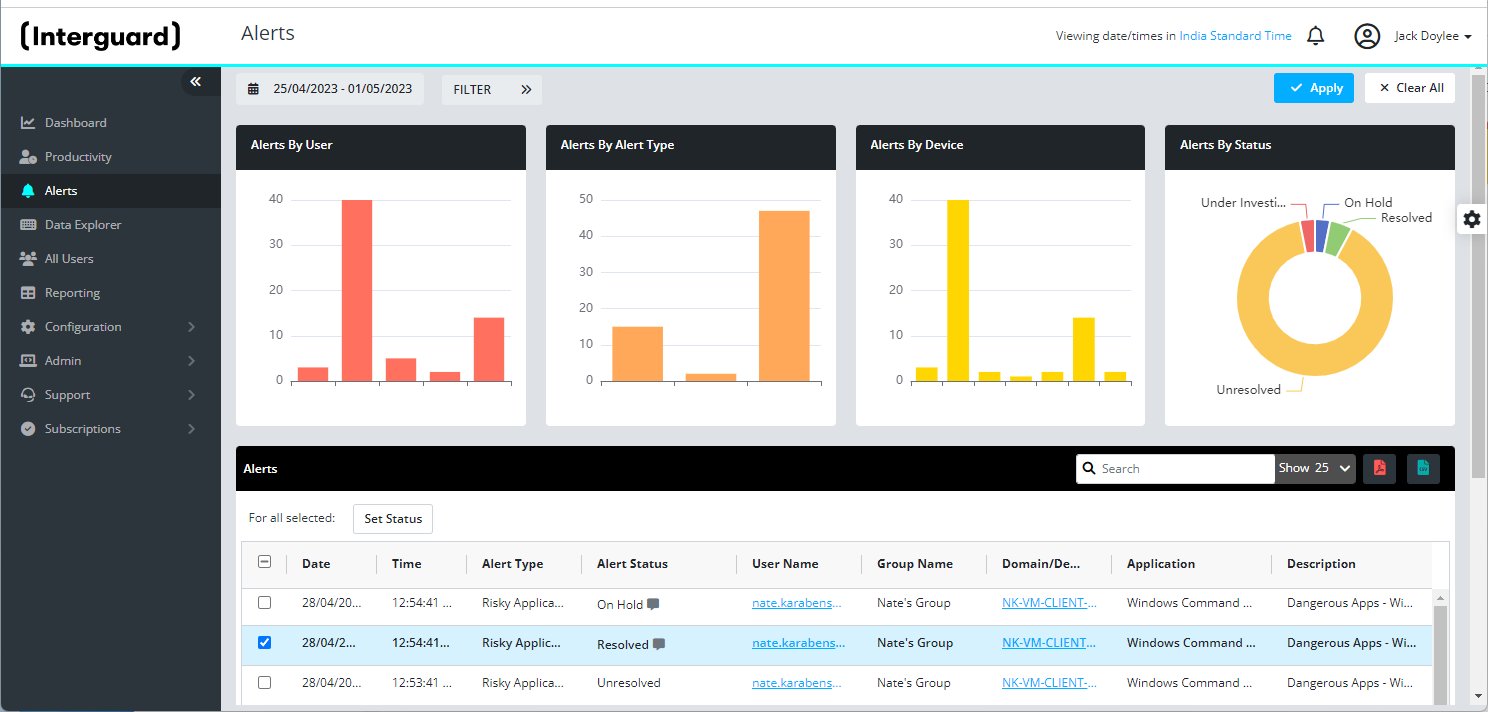
Figure: Alerts
What you can do
- View the most recent alerts triggered or from a specific date.
- View alerts triggered within a group or by a specific user.
- See which alerts have been reviewed or resolved and review them yourself.
- View detailed alert events (double-click any row).
- Read comments from other reviewers.
- Select a filtered view of the grid and export a PDF or CSV file.
Setting up alerts
- Alert Word Detection - Words, phrases, and regular expressions you configure in "categories" are automatically highlighted in Event Details in Data Explorer and on this page. Depending on recording policy settings (and license capability), configured words are detected in:
Chat & instant message conversations
Email messages or subject lines
Keystrokes
Window captions
Filenames
Web searches - Notification Alerts - When conditions of an email notification request are met, the notification event is added to the Alerts page.
Alert Word Notification - Detection of words in specific categories or as a condition in a User Behavior alert.
Website Category Notification - Detection of sites in specific Website categories.
User Behavior Notification - Detection of any number of conditions triggering an email report. - Recording Policy Alerts - Alerts are enabled by Recording Policy settings (options depend on a recording policy's license type)
Alert Word Screenshots - Increased screenshots are requeseted for Keyword Alert Categories.
File Tracking - File activity was detected in a path selected for File Tracking
Printed Document - Printed document capture is requested in the policy.
Risky Application - Activity in an Android application considered "risky" was detected (automatic alert).
Risky Website - A website considered risky was accessed (predefined and automatic)
Filters
Be sure to click Apply after selecting one or more filters.
Click Clear All to clear all filters.
- Date - Click the calendar to select which days of recording data to show.
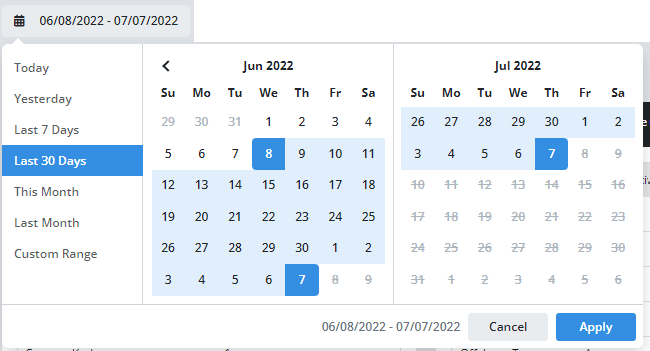
Today - Show data starting (midnight) this morning until now. Data may not be available if based on productivity calculations.
Yesterday - Data from the previous day.
Last 7 Days - (Default setting) Show the last 6 days + today.
Last 30 Days - Show the last 29 days + today.
This Month - All the dates from the first of this month + today.
Last Month - All dates in the previous month.
Custom Range - Click two dates on the calendar from any month. You cannot select future or past dates outside your account's data retention period.
Note: Date/times are shown by default "as recorded," that is, the exact date and time in the time zone of the endpoint device. They can be set to show in the context of "Your Timezone," as set up your account. For example, someone 3 time zones away would appear to stop working at 2 PM when it is 5 PM your time. Use the  setting to change the date/time view.
- Filter - Click to open additional filters. Click the button again to close this filter panel.
- Groups - Show data for All Groups or for users in a selected group.
- Users - Show data for ALL or for a selected individual.
- Device - Show data for ALL for or a selected device.
- Alert type - Show data for ALL or for a selected Alert Type:
Alert Words - An alert word was detected in an event.
Alert Word Notification - An alert word notification was triggered.
Alert Word Screenshots** - An Alert Word in a selected category triggered a screenshot.
File Tracking* - File activity was detected in a path selected selected in the Recording Policy.
Printed Document* - A file was printed (enabled in the Recording Policy).
Risky Application - Activity was detected in an Android application considered "risky" (automatic alert).
Risky Website - A website considered risky was accessed (predefined).
User Behavior Notification - A user's actions triggered a behavior alert email.
Website Category Notification - A website within a category triggered alert email.
- Alert status - Show All Alert Statuses or On Hold, Resolved, Under Investigation, or Unresolved. (See below.)
Alert graphs
Four graphs at the top of the page show at a glance data for your filter selections:
- Alerts by User - Bar chart
- Alerts by Alert Type - Bar chart
- Alerts by Device - Bar chart
- Alerts by Status - Pie chart
The Alerts grid
The Alerts Grid shows the following fields (columns) for each Alert Event. Double-click a row (on a field that is NOT a link) to display the Alert Event Details.
- Date - The day the alert was triggered.
- Time - The time of the triggering event.
- Alert Type - What caused the alert to be triggered. (See Alert Types above.)
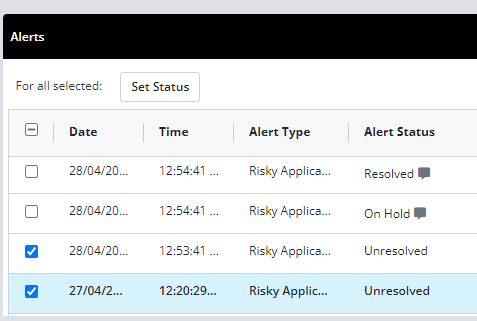
- Alert Status - All alerts are Unresolved until someone changes their status.
On Hold: The alert has been viewed but is not yet under investigation or resolved.
Resolved: The alert event is not a problem or has been resolved.
Under Investigation: The alert event is marked for further investigation.
Unresolved: The default status - the alert has not been evaluated.
- User Name - Shown in the format domain\Display Name. Click a name to link to Data Explorer filtered to this user. Press the back arrow on the top bar to return to the Alerts page.
- Group Name - The Group the user belongs to.
- Domain/Device Name - The name of the device the user was logged into.
- Application - If available, the application where alert was triggered. Otherwise:
Screenshots: An Alert Word triggered the screenshot (any context).
Web Activity: The alert was triggered in web activity (no browser specified).
- Description - More information about the alert event, such as the word or website category that triggered the alert.
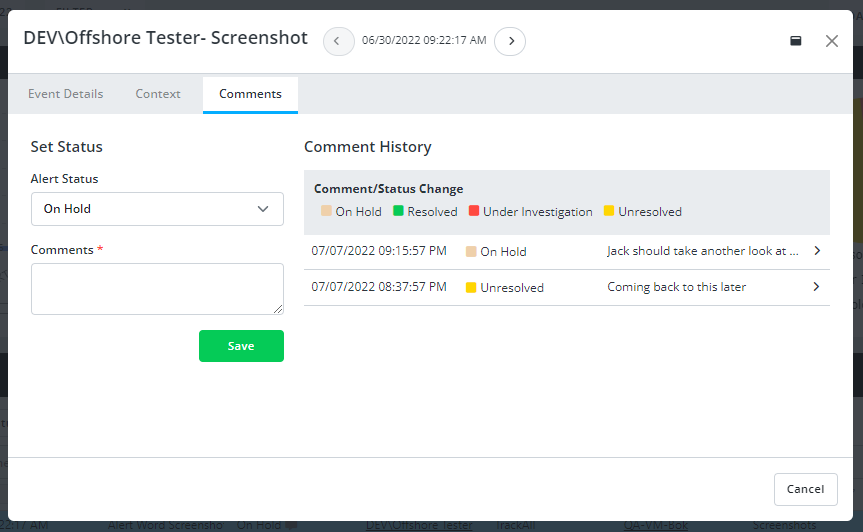
Set Alert Status
There are two ways to set the Alert Status: (1) From the grid or (2) from the Event Details "Comments" tab.
From the grid: Select (check) one or more event rows and press Set Status above the grid.
The Set Status dialog opens. Select the new status and add comments. A comment is required to trace who made the change and why.
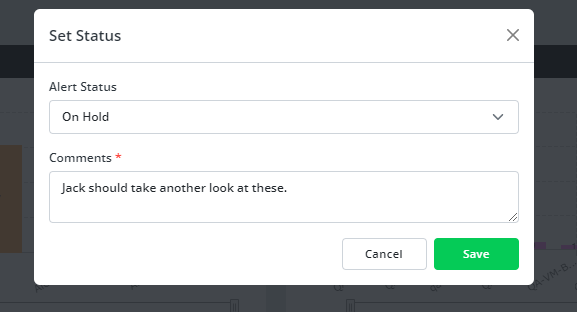
The Comment appears in the Event Details Comment for each Alert event.
Updated: 07/25/2024