Reporting - Reports
Reporting | Scheduled Reports
Access Reporting from the sidebar. Reports and Exports (each on a tab) are based on event records for all or specific activities, selected groups, users, and other criteria. Reports and Exports run immediately or at regular intervals. Reports are automatically delivered by email to the recipients you specify.
NOTE: Keep in mind that most data views allow you to export .CSV and/or .PDF files.
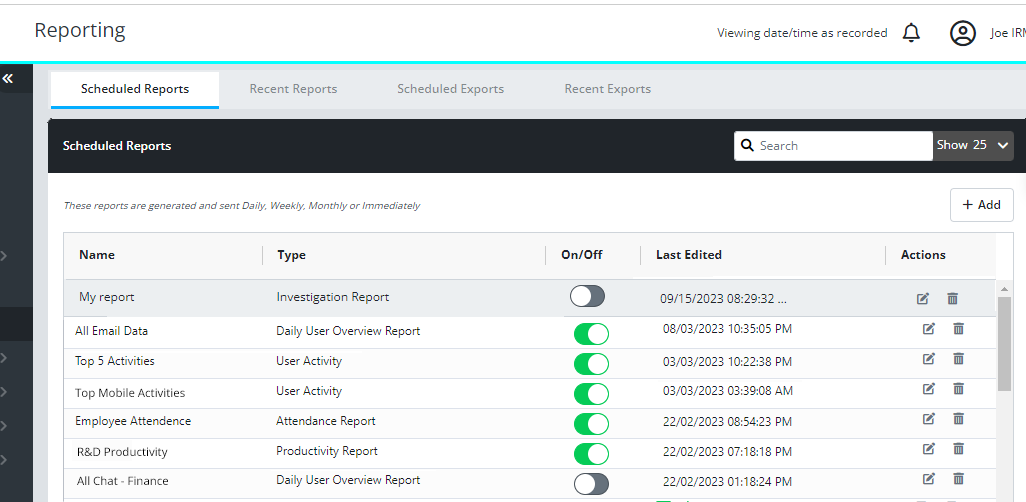
Report profiles are listed in the top panel and generated Recent Reports are listed in the bottom panel. The following pre-defined report types are available:
- Investigations - The scope of the report is the Entire Data Set (everything) by Activity Type.
- Productivity and Attendance - Report on Employee Productivity (based on Group Productivity Settings), Attendance, and Idle Time.
- User Behavior Trends - Report on activity trends to spot behavior changes and unusual activity.
- Standard Top 5 - Report on the top 5 users, groups, or activities.
- Pre-Set - Create PDF visualizations from templates on select activities.
Recent reportsRecent reports
The Recent Reports tab shows reports that are scheduled or have been generated. The latest reports scheduled, processing, or complete appear at the top of the list.
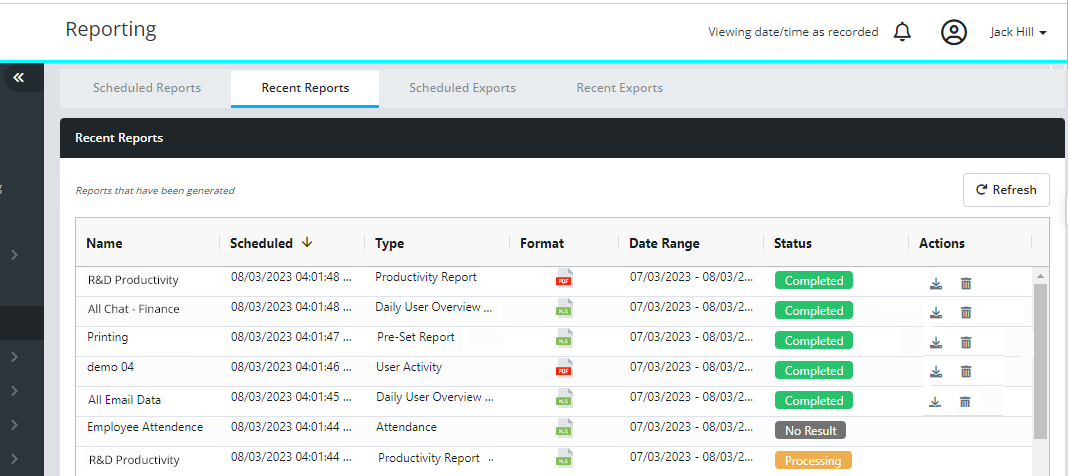
Report status can be:
- Scheduled - The report is scheduled for processing in the future.
- Processing - The report is currently being processed.
- Completed - The report is complete and can be viewed.
- No Result - No data matched the report criteria. The report was not processed.
Actions:
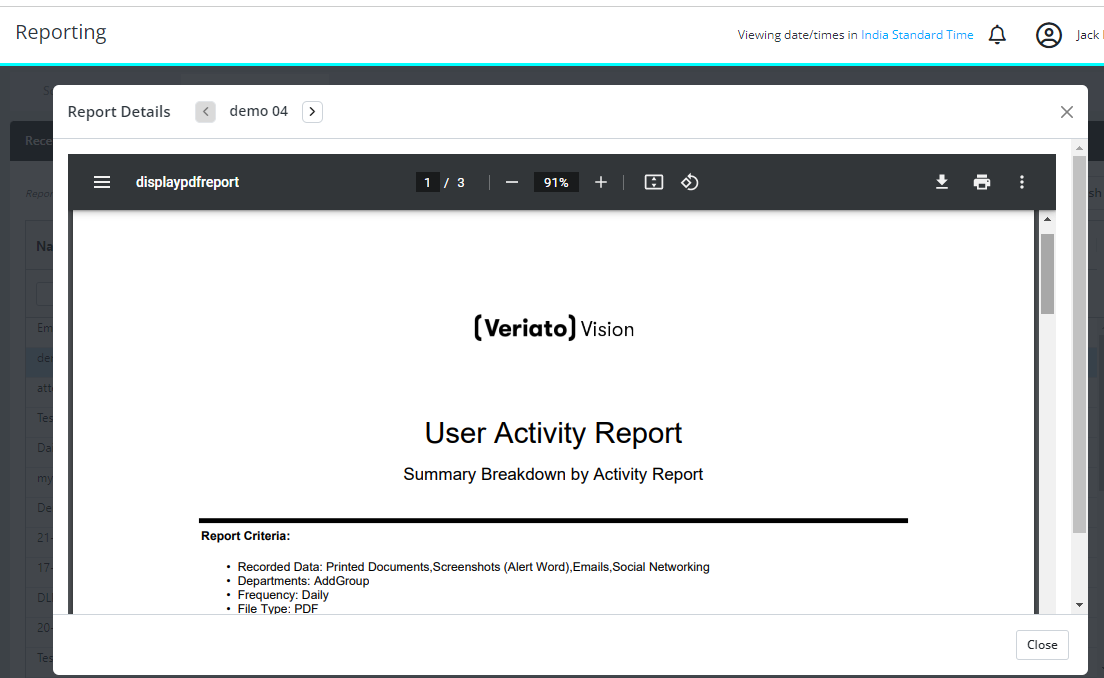
- View - Press the button when it appears to display the report in a popup window, where you can download or print it. Press times to close the report window.
- Download - Press the download button when it appears to download the completed report.
- Delete - Press the trash button when it appears to delete the report.
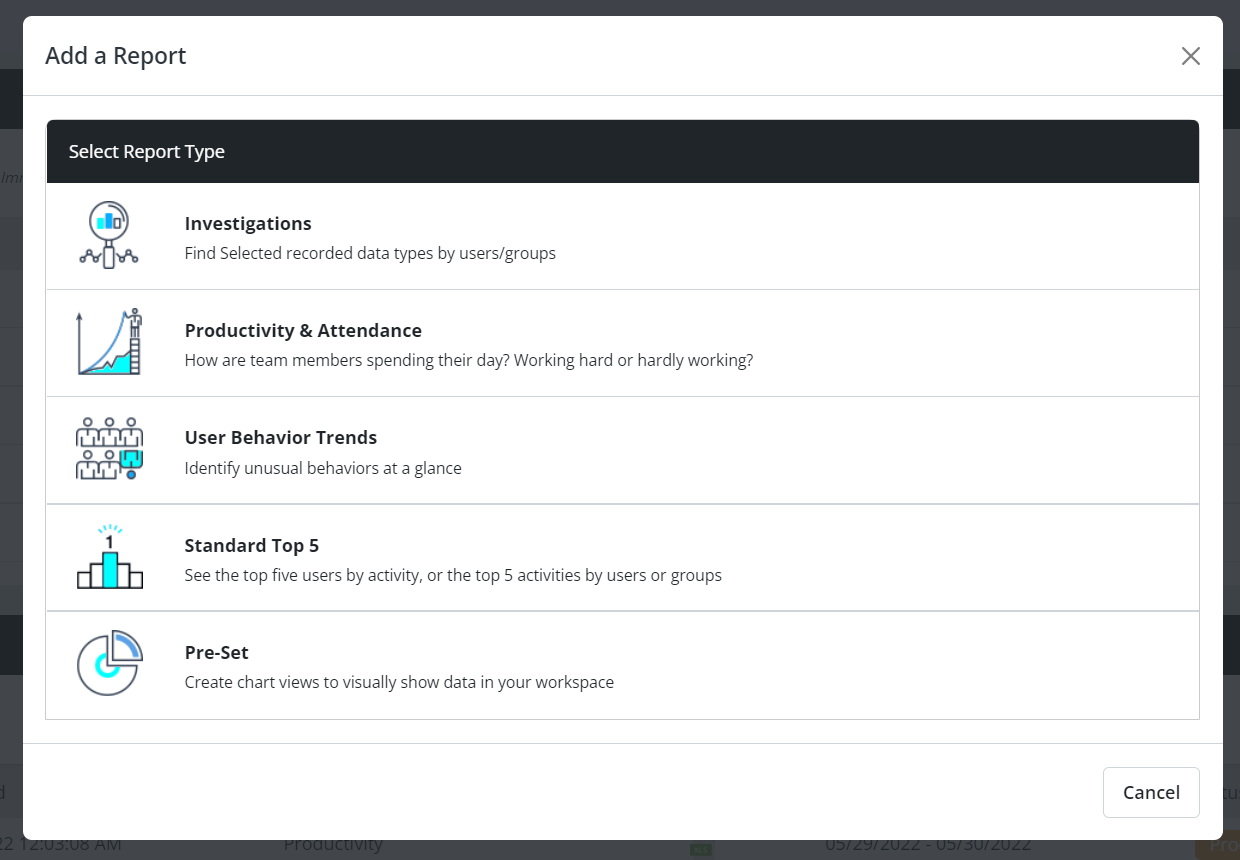
Add reportsAdd reports
Set up Reports from the Reports tab in Reporting. Press Add to define a new Report or press Edit next to an existing scheduled report. The Report wizard opens.
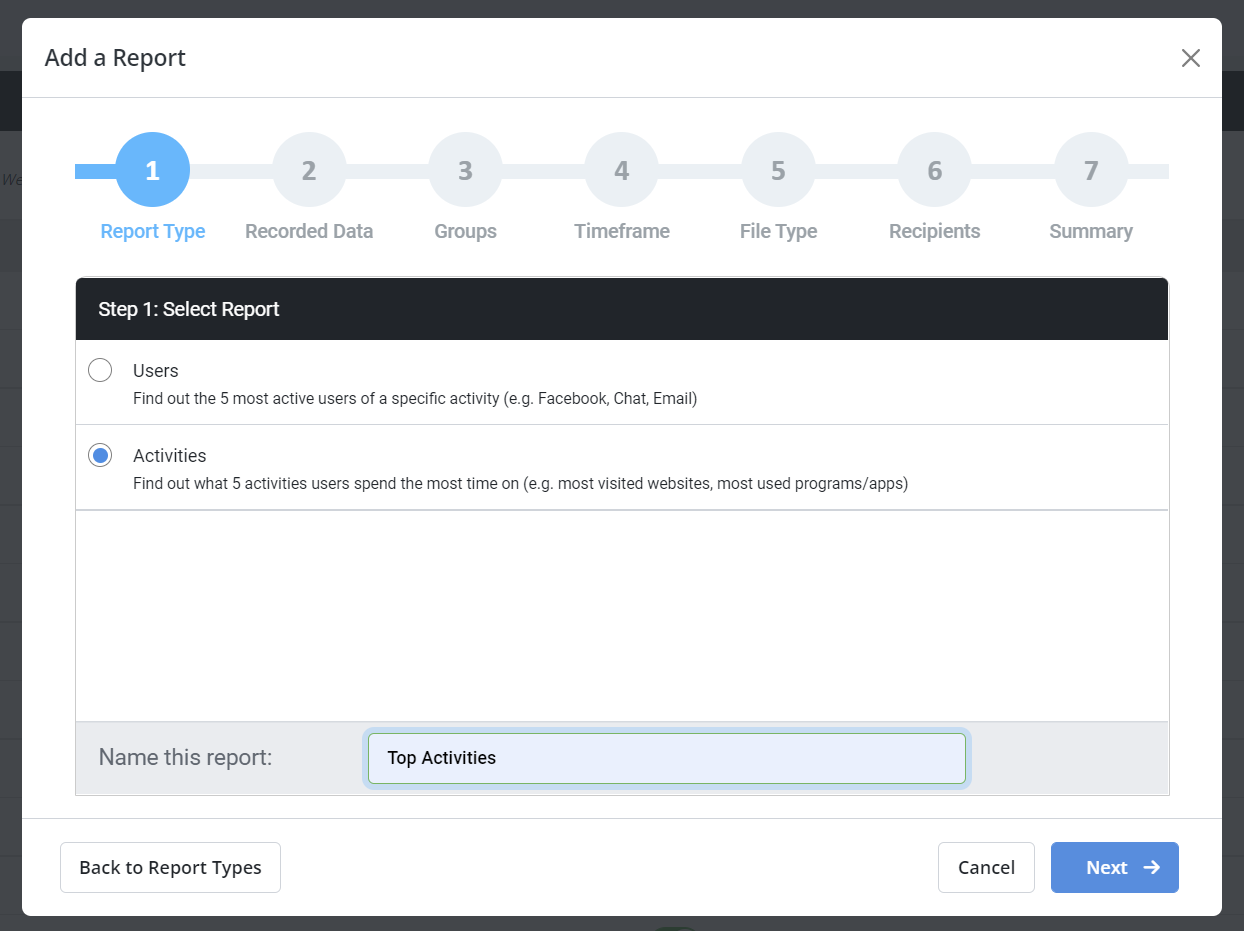
Start by choosing a Report Type. The wizard helps you set up 5 types of reports: Investigations, Productivity & Attendance, User Behavior Trends, Standard Top 5, and Pre-Set.
Step 1: Select a report focus and name the report (enter a name at the bottom of the wizard panel).
Step 2: Select Data Types.
Step 3: Select Groups and/or Individuals to report on. To include all users, select every department.
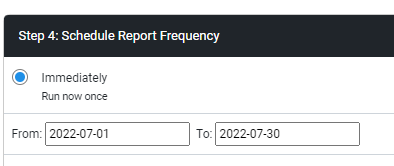
Step 4: Schedule Report Frequency (Timeframe).
- Immediately - Run once, now. Choose any time range. Available for Investigations and User Activity (Standard Top 5).
- Daily - Run each day. The report includes data from yesterday.
- Weekly - Run each Monday. The report includes data from the past week.
- Monthly - Run on the first day of each calendar month. The report includes data from the past month.
Step 5: Select a File type - PDF or Excel (.csv).
Step 6: Recipients - Who receives the report as an email. Enter any valid email address and press Add to start a recipient list.
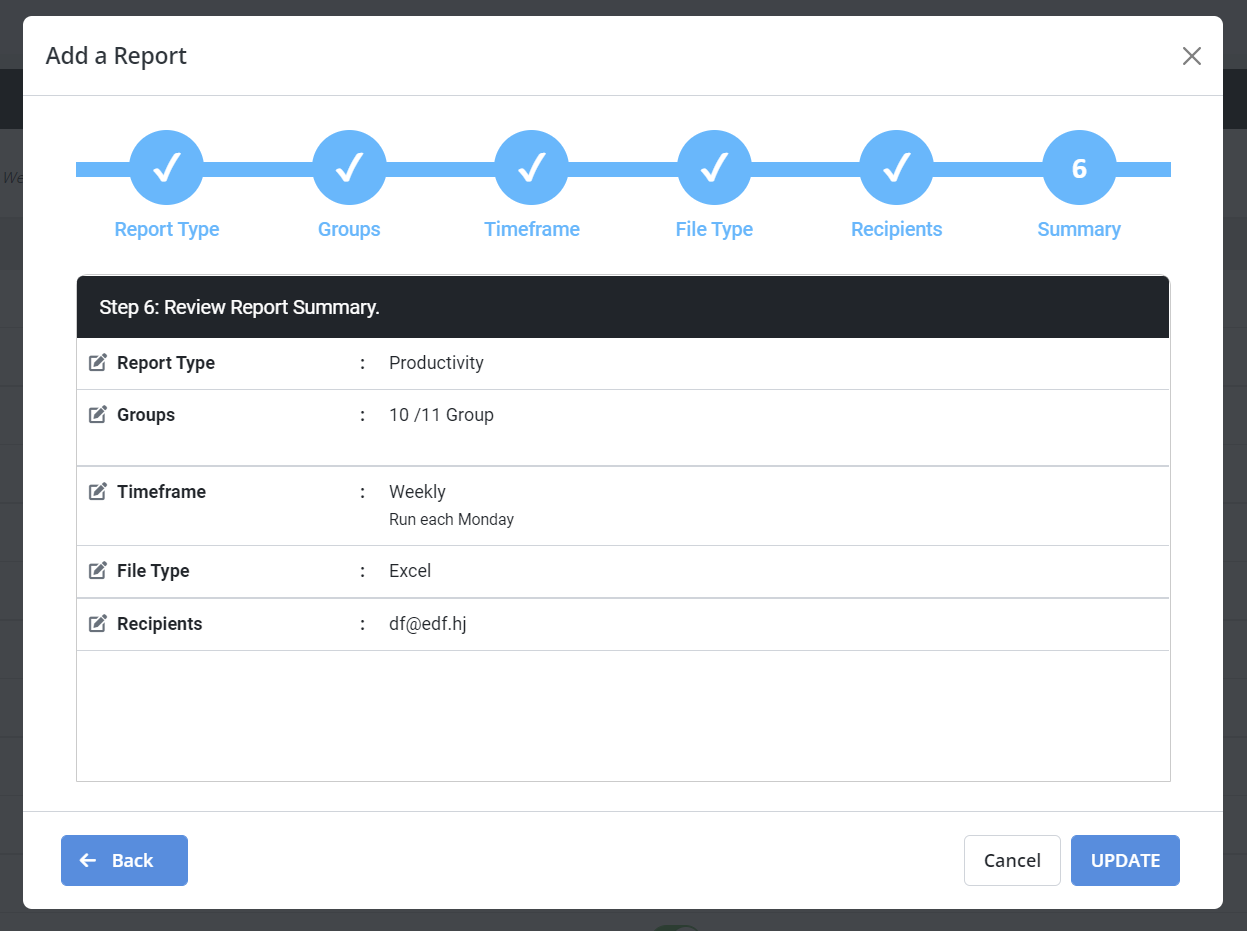
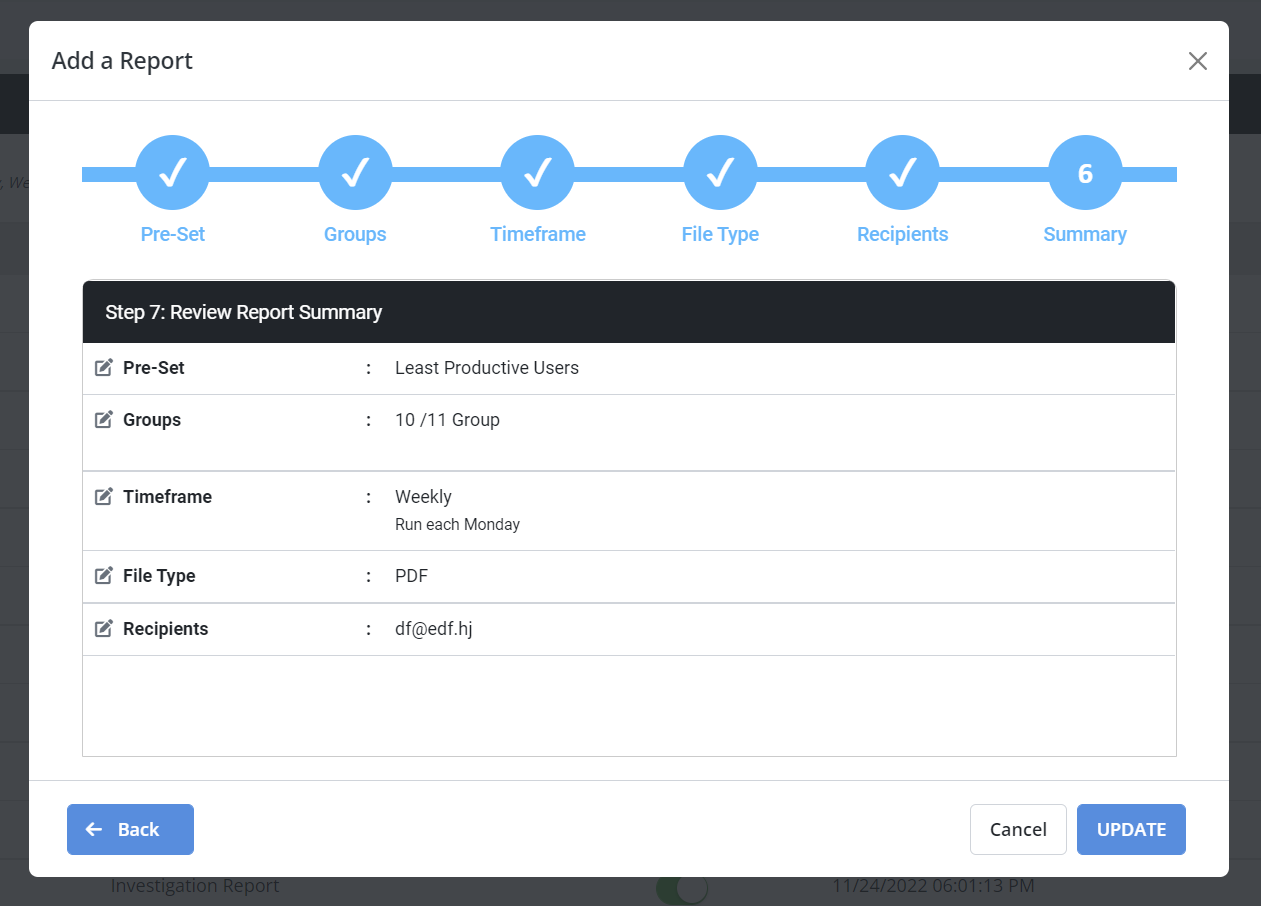
Step 7: Summary - Review your choices and press Create.
The report is added to the Scheduled Reports list and is scheduled to gather the data you specified and run automatically as you chose.
InvestigationsInvestigations
The scope of an Investigation report starts with ALL the data available. These reports let you zero in on the exact data you need to see. Select one of two Report Types:
Step 1: Select a report focus and name the report (enter a name at the bottom of the wizard panel).
- Entire Data Set by Activity Type - Investigate all or selected activities
- Filtered Data Using Multiple Critiera, Rules, & Sub-conditions
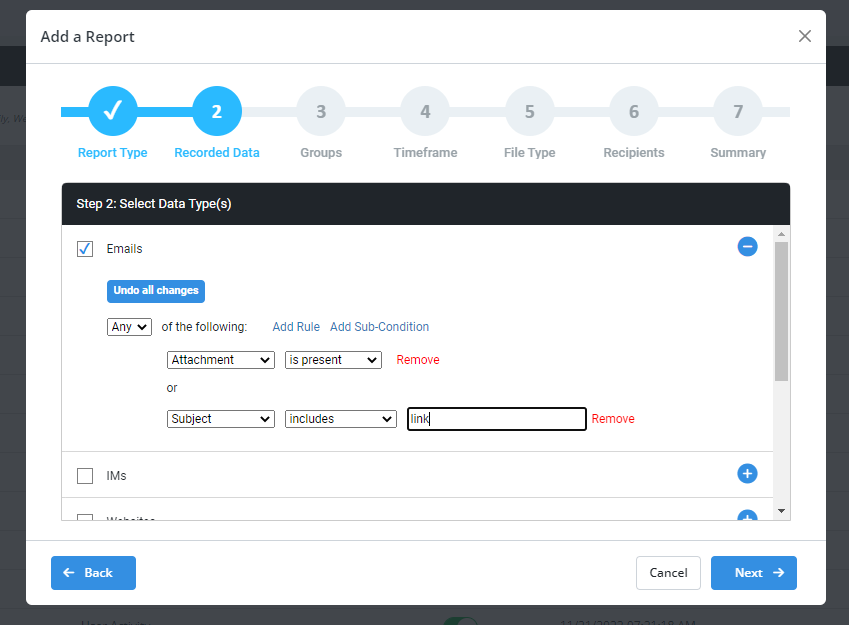
Step 2: Select Data Type(s).
- Select one or more activities to investigation: Emails, IMs, Websites, etc.
-
If you selected Filtered Data, you can expand each data type to add conditions.
Available conditions depend on the data type.
Select All of the following to use an AND operator between conditions (all must be met).
Select Any of the following to use an OR operator between conditions (any can be met).
Select Add Rule to add a condition and Add Sub-Condition to further refine the rule.
Continue following the wizard steps until the report is complete and press Create.
Productivity and attendanceProductivity and attendance
Report on Employee Productivity (based on Group Productivity Settings), Attendance, and Idle Time. The scope of a Productivity report starts with the type Report you choose. These reports provide optimal views of productive, unproductive, active and idle times.
Step 1: Select one of 3 report types.
- Productivity Report - Gathers detailed metrics productive, unproductive and neutral activities.
- Attendance Report - Shows daily logon and logoff times.
- Idle Time Report - Gathers detailed metrics on employee inactivity during work hours.
Step 2: Select data types for the report to cover.
Step 3: Schedule Report Frequency - These reports run Daily, Weekly or Monthly. They cannot run immediately because productivity metrics require at least a day to calculate.
Continue following the wizard steps, review the Summary, and press Create.
User behavior trendsUser behavior trends
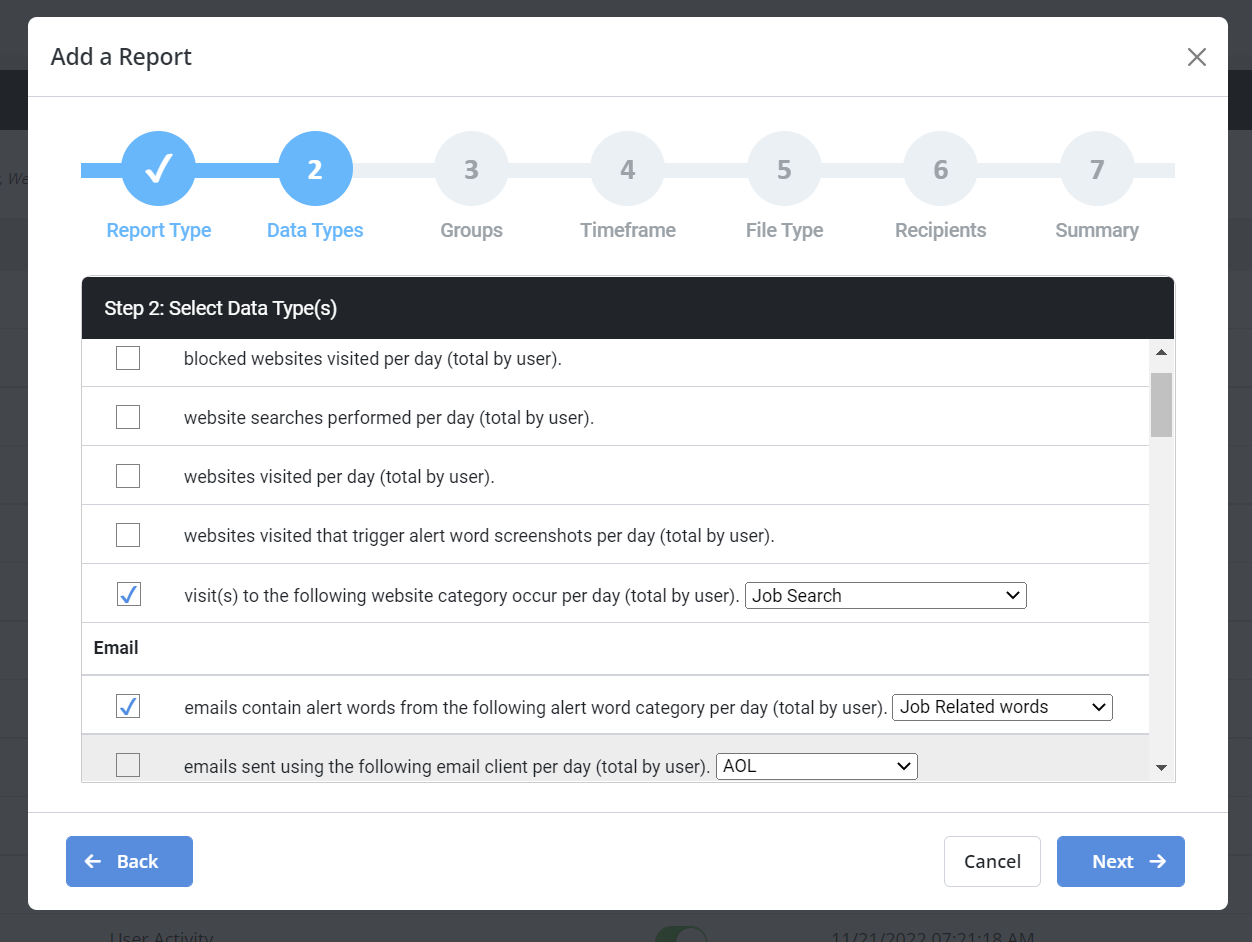
The wizard presents one report choice for User Behavior trends: Identify unusual behaviors by reviewing activities ranked by user. Shape this report by selecting Data Types in step 2. Data shown as daily totals for each user. This report can only be run Daily - reporting on the previous day.
| Select Data Type(s) | |
|
Website
|
|
|
|
|
Screenshots
|
|
|
Logon Events
|
|
|
Application Events
|
|
|
File Tracking
|
|
|
Instant Messaging
|
|
|
Keystroke Events
|
|
|
Printing
|
Standard top 5Standard top 5
Create reports that reveal the top 5 users in selected event types OR the top 5 activities among selected event types.
Step 1: Choose to report on top Users or top Activities.
Step 2: Select the Recorded Data to include.
Step 3: Select which User Groups the reports will be based on.
Step 4: Schedule the report frequency (Timeframe): Immediately, Daily, Weekly, or Monthly.
Step 5: Select the report output format (JPG, PDF, or Excel).
Step 6: Specify email recipients.
Step 7: Review a summary of your selections and Create the report.
Pre-set reportsPre-set reports
Create PDF visualizations from templates. Step 1 allows you to (A) select charts from the left column to include in the report and (B) choose the order of the charts. In the following example, 4 charts were selected from Productivity. To order the charts, simply drag and drop them into position.
The charts are the same as what appears in the Dashboard. For each chart selected, you can specify whether you want a Bar, Line, or Pie Chart or a Tabular display. Select from the following:
| Select Charts | |
|
|
|
|
|
Websites (15)
|
|
|
Applications
|
|
|
Emails
|
|
|
Screenshots
|
|
|
DLP |
|
|
Mobile |
|
|
Printing
|
Edit reportsEdit reports
In the top Scheduled Reports panel, click the Edit ![]() icon at the right end of the row. The Reports wizard opens, and you can step Back through the panels, making changes as you wish. When the changes are complete, click Update on the Summary page.
icon at the right end of the row. The Reports wizard opens, and you can step Back through the panels, making changes as you wish. When the changes are complete, click Update on the Summary page.
Delete reportsDelete reports
In the top Scheduled Reports panel, click the Delete trash icon at the right end of row. You are asked to confirm the deletion.
Updated: 05/01/2024